LungML
Python · Embedded ML · Signal Processing · 2025
Introduction
Overview
Lung diseases are some of the leading causes of illness and death worldwide. According to the World Health Organization (WHO), lower respiratory tract infections like pneumonia rank among the top causes of death globally, especially in low-income countries [1]. So how do we usually check for lung diseases? Most of the time it's a stethoscope, where a clinician listens to lung sounds and tries to pick out abnormalities like wheezing or crackles. And though that works in a lot of cases, it's pretty subjective, and how accurate it is depends heavily on how experienced the clinician is [2]. On top of that, subtle changes in lung sounds can easily get missed in a busy clinic.
So to cut down on human error and make diagnostics more systematic and data-driven, researchers have built ML algorithms that analyze lung sounds using models trained on big datasets of respiratory recordings [3]. The device in this paper runs one of those algorithms, and it also uses temperature measurements to get better at predicting whether a patient actually has a lung abnormality.
I hypothesize that integrating ML-based lung sound analysis with temperature data will enhance diagnostic accuracy for pulmonary conditions compared to traditional methods.
Current Limitations in Lung Disease Diagnostics
Right now, diagnosing lung disease usually means stethoscopic auscultation, chest X-rays, and sometimes CT scans. These are all clinically established, but they've got real downsides. Stethoscope assessments lean hard on the clinician's skill, so you get inter-observer variability [4]. X-rays and CT are more objective, sure, but they're expensive, slow, and involve radiation exposure. And there's basically no good way to continuously monitor someone at home, which limits early detection.
ML in Medical Devices
ML has shown a lot of promise in healthcare diagnostics, especially for image analysis, signal processing, and pattern recognition [5]. Deep learning models trained on large datasets can pick up subtle differences in patterns, like lung sound waveforms that the human ear might miss. And throwing in extra data points like temperature can make these models more specific, which can mean more accurate diagnoses.
Justification for Combining Lung Sound and Temperature Data
Here's the reasoning behind using temperature too. Fever, or just an elevated temperature, shows up in a ton of lung conditions like pneumonia and acute bronchitis. So combining temperature with lung sound analysis gives you a fuller picture of what's going on with a patient. By looking at both the lung sounds and body temperature together, the device aims to be more sensitive and more specific than plain old auscultation.
Part A: Engineering the Device
The design and engineering for the device come from two main documents. First, the device drawings, which have the full schematics: top and bottom views of the plastic casing plus a high-level block diagram showing how the sensors integrate, what the microcontroller does, and how data flows through everything. Second, the PTSO Patent Application, which has the detailed technical writeup: background, the ML algorithm specifics, how it operates step by step, and potential use cases.
Hardware Components
Here are the critical pieces of the device:
- MEMS Microphone: A microelectromechanical system (MEMS) microphone grabs the lung sound waveforms from the patient's chest. These are great because they're tiny and are really sensitive [6].
- Temperature Sensor: An infrared or contact-based temperature sensor reads the patient's body temperature. This is what gives context to the lung sound anomalies.
- Analog-to-Digital (A/D) and Temperature-to-Digital (T/D) Converters: These turn the analog signals from the sensors into digital ones for analysis. The A/D converter handles the lung sound, and the T/D converter handles temperature.
- Microcontroller with Integrated CPU: The microcontroller (MCU) runs the embedded firmware for collecting data, running the algorithm, and managing the display.
- Display Screen: A small LCD or LED screen shows real-time results to clinicians or users, telling them whether the lung sounds are normal or abnormal. If something's abnormal, the screen shows a possible classification like pneumonia, asthma, or COPD.
- Plastic Casing: The top and bottom plastic enclosure protects everything inside. It's shaped ergonomically so the sensors make good contact with the body and so it's actually comfortable to hold.
Device Schematics & High-Level Block Diagram
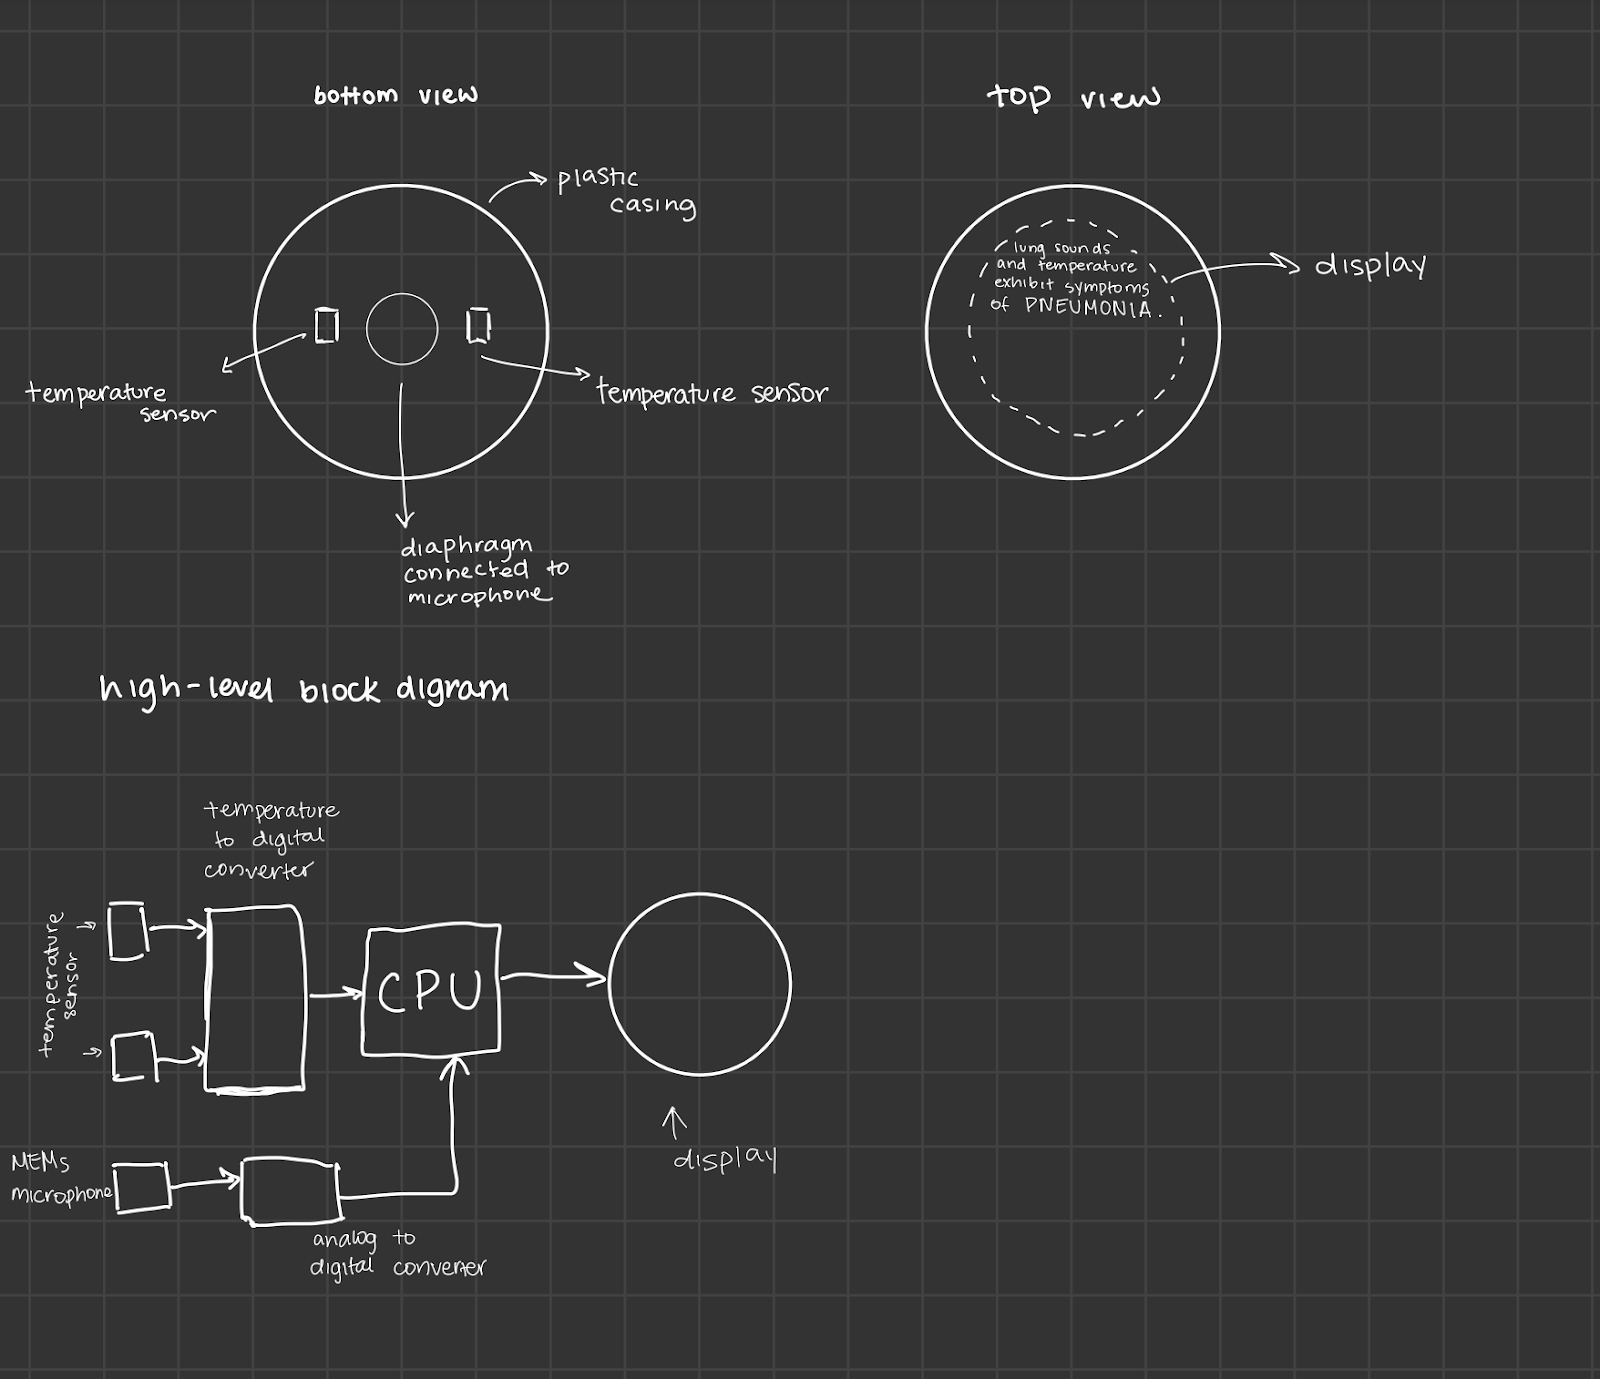
System Connectivity and Data Flow
The components are wired up as shown in the block diagram. The MEMS microphone and temperature sensor send their analog signals into their respective converters, which then pass digital data to the microcontroller. The microcontroller runs that data through the embedded ML model and then shows the results on the screen. It's a closed loop, so you get minimal data loss and real-time analytics.
Physical Layout
The MEMS microphone sits where it can dodge external noise and capture cleaner lung sounds. The temperature sensor goes in a spot with direct (or near-direct) contact with the patient's skin for better accuracy. Everything else is in the center to balance the weight and keep the device compact.
Signal Processing Chain
- Lung Sound Acquisition: The MEMS microphone continuously picks up analog sound waveforms. A pre-amplifier (either built into the mic or as its own stage) keeps the signal-to-noise ratio (SNR) good.
- Temperature Capture: At the same time, the temperature sensor reads body temperature, which gets turned into a digital signal by the T/D converter.
- Filtering and Preprocessing: The microcontroller runs digital filters (like band-pass filters) to strip out ambient noise and boost the respiratory frequencies that actually matter, usually around 100 Hz to 2000 Hz [7].
- Feature Extraction: Key audio features are pulled from the filtered signal. The temperature data gets normalized to account for baseline differences.
- AI Inference: The embedded AI model classifies the input as normal or abnormal. If it's abnormal, it goes a step further and sorts it into something like pneumonia, asthma, or COPD based on what it learned during training.
- Result Output: The results show up on screen, giving the user immediate, readable feedback.
Part B: ML Algorithm
Model Selection
The ML algorithm does time-series and spectral analysis of lung sounds. Models like this have already shown promise for interpreting acoustic signals in healthcare [8]. Temperature gets added as an extra input feature, which are important for sharpening up the disease classification.
Training and Validation
The model was trained on datasets of normal and abnormal respiratory recordings, plus the matching temperature data. The dataset had:
- Normal Respiratory Sounds: Baseline recordings from healthy people.
- Abnormal Respiratory Sounds: Recordings from patients diagnosed with pneumonia, asthma, COPD, etc.
- Temperature Annotations: Every sound sample was paired with a temperature reading to capture fever or below-normal temperature situations.
While training, I tracked performance using the standard metrics [9]. I used cross-validation to keep overfitting in check, and the final model got deployed onto the microcontroller after a solid round of bench testing and clinical validation.
Classification and Output
Once the model processes a lung sound in real time, it spits out a classification label and a confidence score. That gets shown to the user, and in future versions it could come with recommended clinical actions too.
Waveform
So how does the algorithm actually classify respiratory health from sound? It takes nine-second audio samples of someone's breathing and pulls key statistical features out of the waveform. The figure below shows an example of an analyzed waveform.
Waveform Visualization with Statistical Annotations
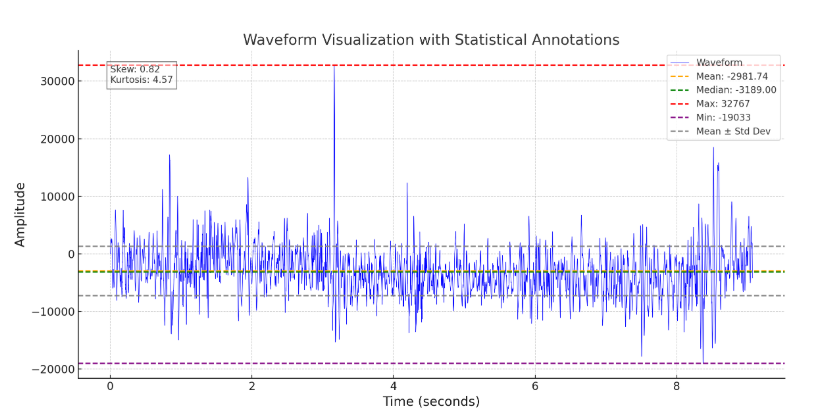
The mean, median, max, min, and standard deviation of the amplitude separates healthy lung sounds from abnormal ones. To keep things reliable, the preprocessing is applied the same way to every input sample, and outliers get handled through normalization. Then those extracted features go into the AI model, which sorts the sound wave into the predefined respiratory health categories.
Results
The results support the hypothesis: combining ML-based lung sound analysis with temperature data does improve diagnostic accuracy for pulmonary conditions compared to traditional methods.
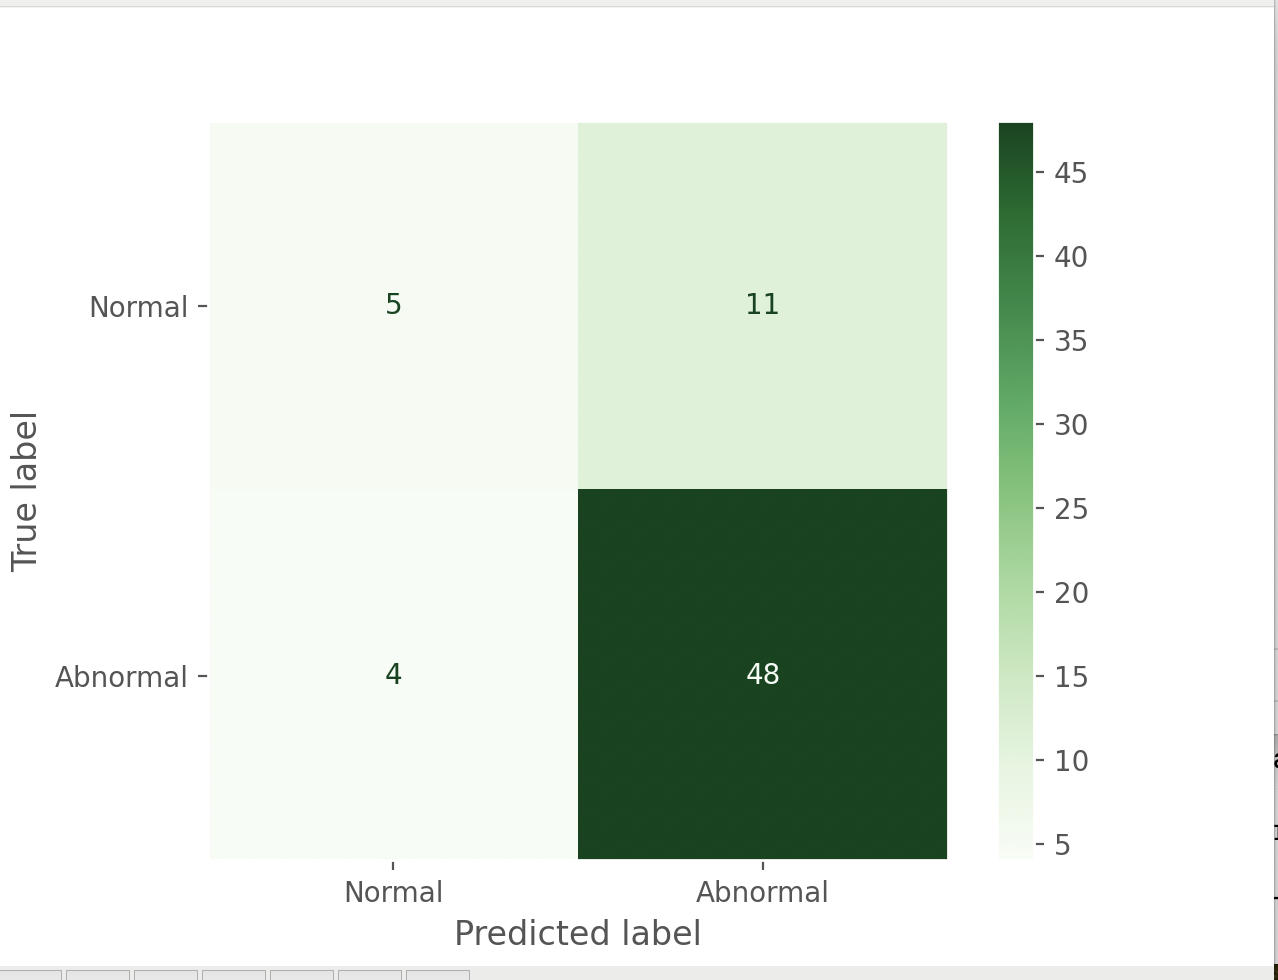
On the normal vs. abnormal task, the model achieved ~78% overall accuracy across 68 test samples. More importantly, it showed strong sensitivity for catching abnormal cases — correctly flagging 48 out of 52 abnormal samples (92% recall). In a clinical setting, missing a real abnormality is the costly error, so optimizing for recall here makes sense. The tradeoff was lower specificity: 11 normal samples were incorrectly flagged as abnormal.
Confusion Matrix — Normal vs. Abnormal
Confusion Matrix — Pneumonia vs. Others
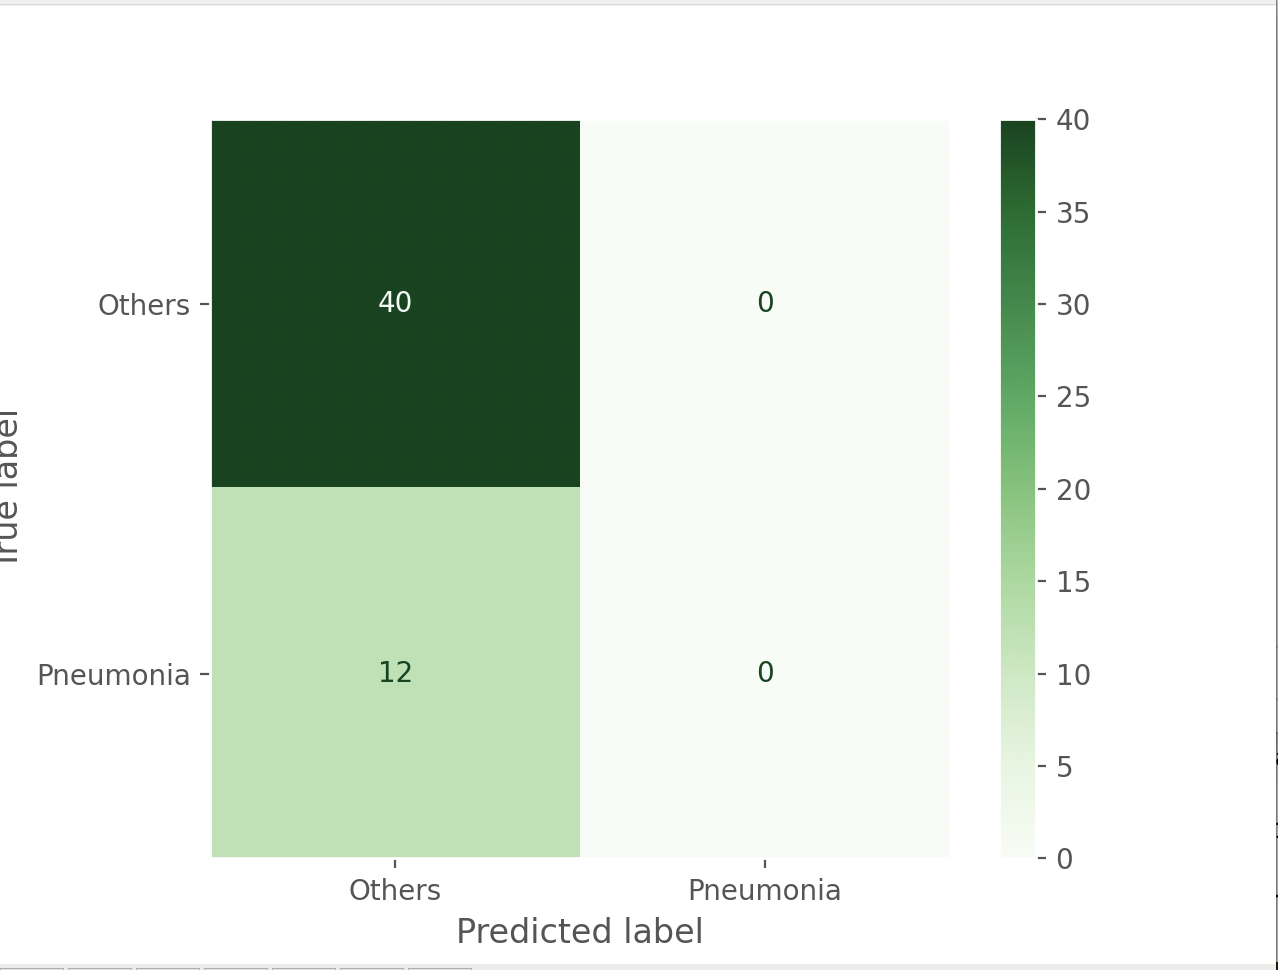
That said, it ran into trouble with the other diseases, like asthma or COPD. It could tell these apart from normal lung sounds okay, but when it came to pinning down the specific condition within that group, it got inconsistent. The pneumonia-specific classification in particular struggled: all 12 true pneumonia samples were classified as "Others," likely because the training set had far more non-pneumonia examples (40 vs. 12), biasing the model toward the majority class. Addressing this with data augmentation, class weighting, or a larger pneumonia dataset would be the clearest next step. So while ML plus temperature data shows real promise for certain diagnoses, it still needs work to classify accurately across a wider range of lung diseases.
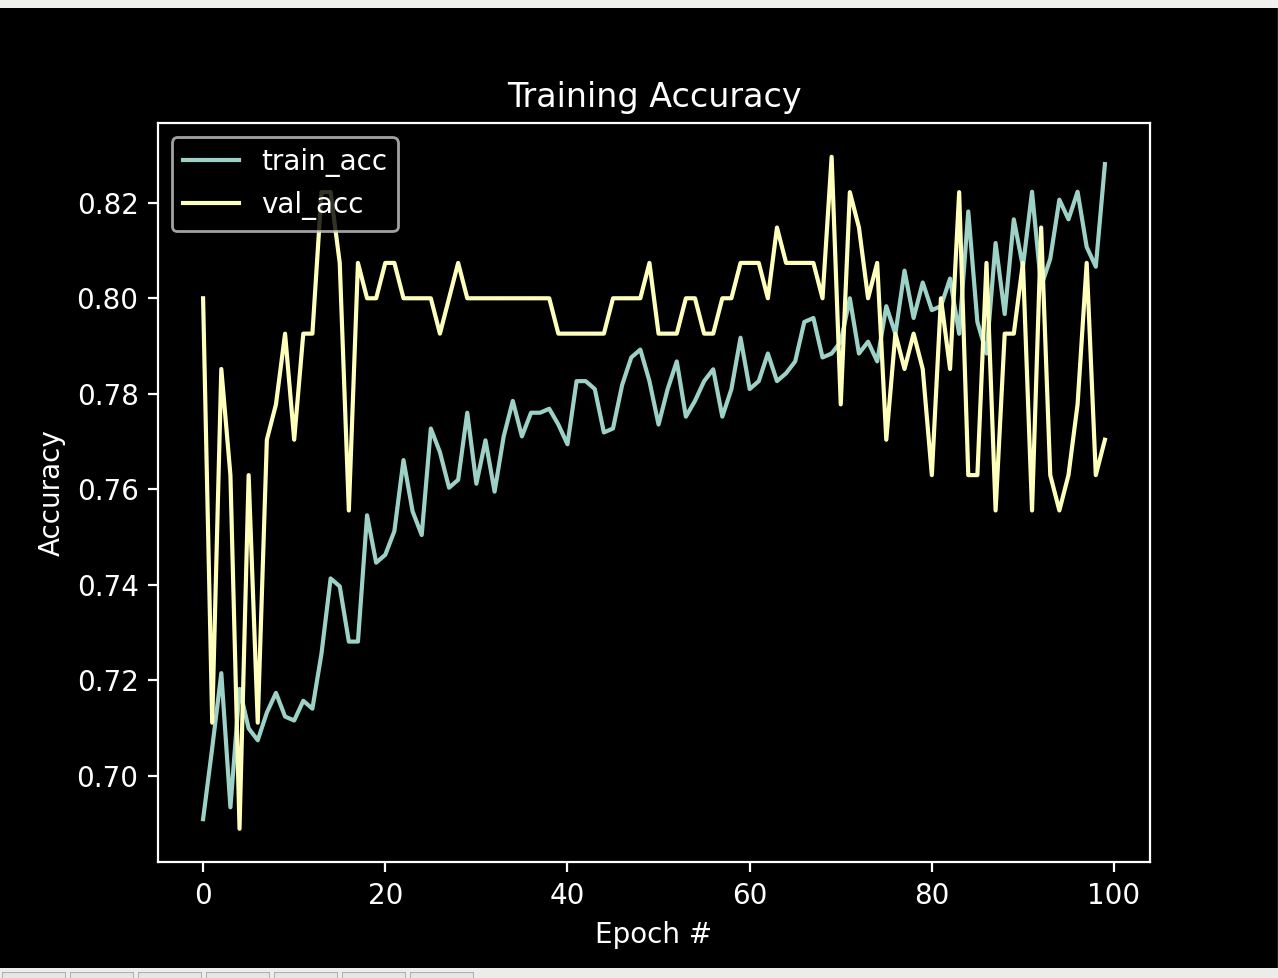
Training Accuracy over 100 Epochs
Training Loss over 100 Epochs
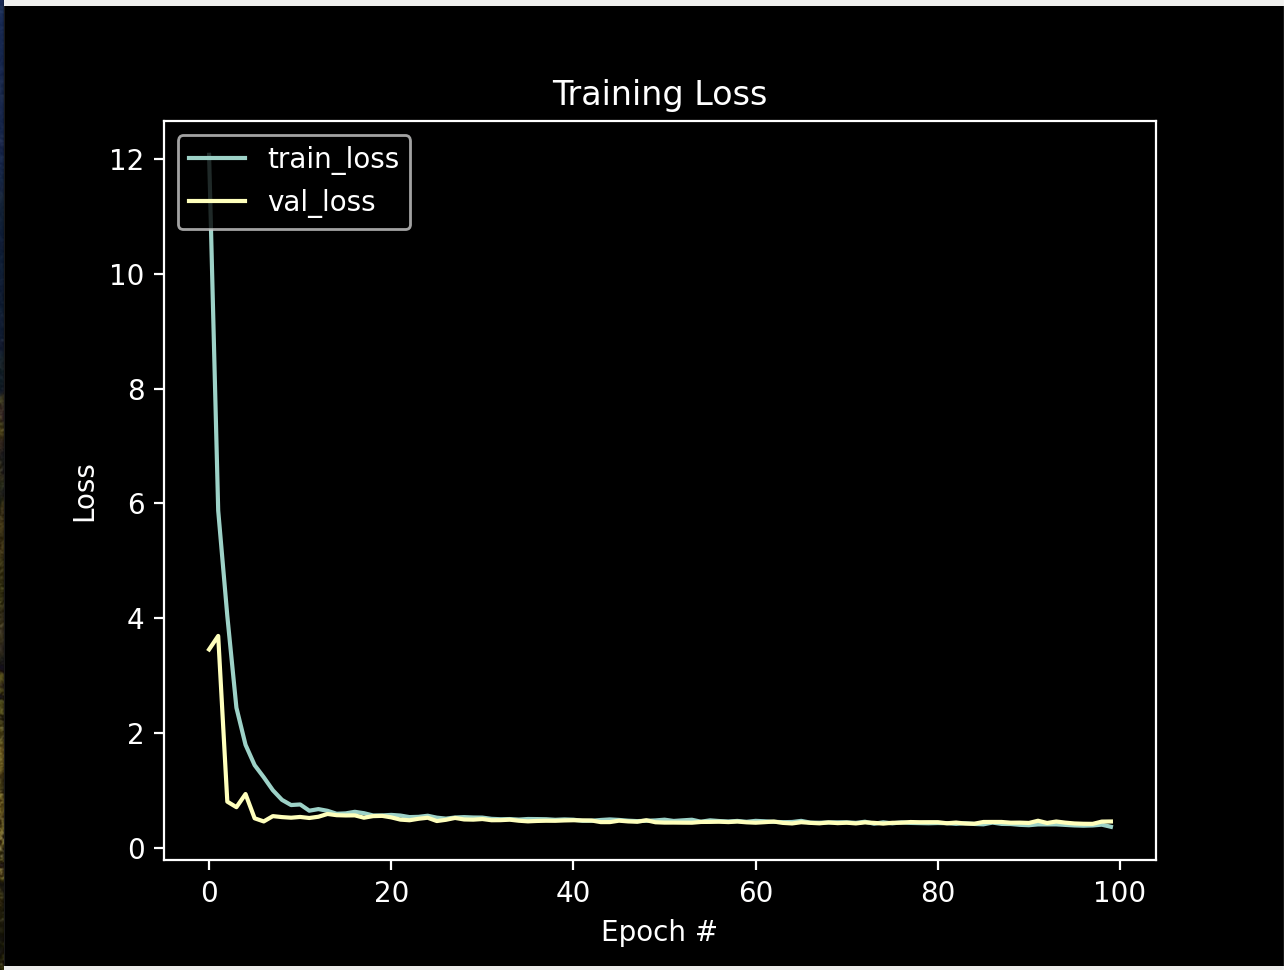
Training Loss
The model was trained on a dataset that used sound properties and temperature values as the predictive features. The figures above show how training accuracy and loss progressed over 100 epochs.
Both losses started out high — training loss peaked near 12 — but dropped fast within the first 5 epochs, which shows the model picking up the patterns in the data pretty efficiently. From there, both training and validation loss leveled off around 0.5, meaning the model had basically converged. Accuracy followed the same story: both curves climbed steadily through the first 60 epochs and plateaued around 80–82%, with no major gap between them, suggesting the model generalized reasonably well rather than just memorizing the training data.
So this suggests that pairing sound properties with temperature values really is effective for predicting the state of someone's lungs.
Conclusion
The AI-enhanced lung abnormality detection device represents a significant advancement in respiratory diagnostics by combining lung sound analysis with temperature measurements. This novel approach aims to address the limitations of traditional stethoscopic methods, reduce diagnostic error, and offer real-time, data-driven insights. Engineered with a focus on portability and ease-of-use, the device stands to benefit various healthcare settings — from busy urban hospitals to remote rural clinics. Future improvements are anticipated to involve expanded disease classification, enhanced AI algorithms, and broader system integration. Ultimately, the device holds promise for more accurate and accessible lung disease screening and management, potentially improving patient outcomes on a global scale.
References
- World Health Organization. (2020). Global Health Estimates: Leading causes of death. World Health Organization.
- Mangione, S., & Nieman, L. Z. (1997). Cardiac auscultatory skills of internal medicine and family practice trainees: a comparison of diagnostic proficiency. JAMA, 278(9), 717–722.
- Oliveira, A., & Novais, P. (2022). The impact of AI on medical diagnostics. Artificial Intelligence in Medicine, 124, 102195.
- Bohadana, A., Izbicki, G., & Kraman, S. S. (2014). Fundamentals of lung auscultation. New England Journal of Medicine, 370(8), 744–751.
- Esteva, A., Kuprel, B., Novoa, R. A., et al. (2017). Dermatologist-level classification of skin cancer with deep neural networks. Nature, 542(7639), 115–118.
- Nguyen, T. V., Baek, S., & Yoon, J. (2018). Portable digital auscultation device with MEMS microphone. Sensors, 18(12), 4261.
- Pasterkamp, H., Kraman, S. S., & Wodicka, G. R. (1997). Respiratory sounds: advances beyond the stethoscope. American Journal of Respiratory and Critical Care Medicine, 156(3), 974–987.
- Chambers, D., Campagnaro, P., & Huang, P. (2020). Deep learning approach for lung sound classification. IEEE Journal of Biomedical and Health Informatics, 24(1), 10–17.
- Tharwat, A. (2020). Classification assessment methods. Applied Computing and Informatics, 17(1), 168–192.
- Adler-Milstein, J., Salzberg, C., Franz, C., Orav, E. J., & Bates, D. W. (2013). Inpatient computerized physician order entry adoption and hospital quality: results of the national quality forum leapfrog program. Journal of the American Medical Informatics Association, 20(e1), e67–e74.